Feral Interactive is a UK-based porting house that specializes in bringing Windows games to other platforms like Linux and macOS. One of their most recent projects was bringing the game Shadow of the Tomb Raider to Linux. I wanted to compare the performance of their native Linux version of the game versus running it in Linux using a popular compatibility layer called Wine. Running games on Linux with Wine often incurs some performance cost compared to Windows so there is still a market for native Linux ports that can recover some of that lost performance.
Conveniently, Shadow of the Tomb Raider contains a built in benchmark tool that will spit out its results to a text file where it can then be analyzed with R. The raw data looks a little like this:
  frame  time delta memory
  <int> <dbl> <dbl>  <dbl>
1     1   0     0     2341
2     2  14.4  14.4   4462
3     3  35.7  21.3   4462
4     4  53    17.3   4462
5     5  72.1  19.1   4462
6     6  91.6  19.5   4462
Frame is the id of the current frame, time is the milliseconds since the start of the benchmark, and delta is the amount of time it took to draw the frame. Most gamers don't really care about these numbers though; the most relatable metric is frames-per-second which is the number of frames that are able to be drawn in one second. To calculate this I just look a the time it took to draw the previous 50 frames, then 50 divided that time is the rolling FPS.
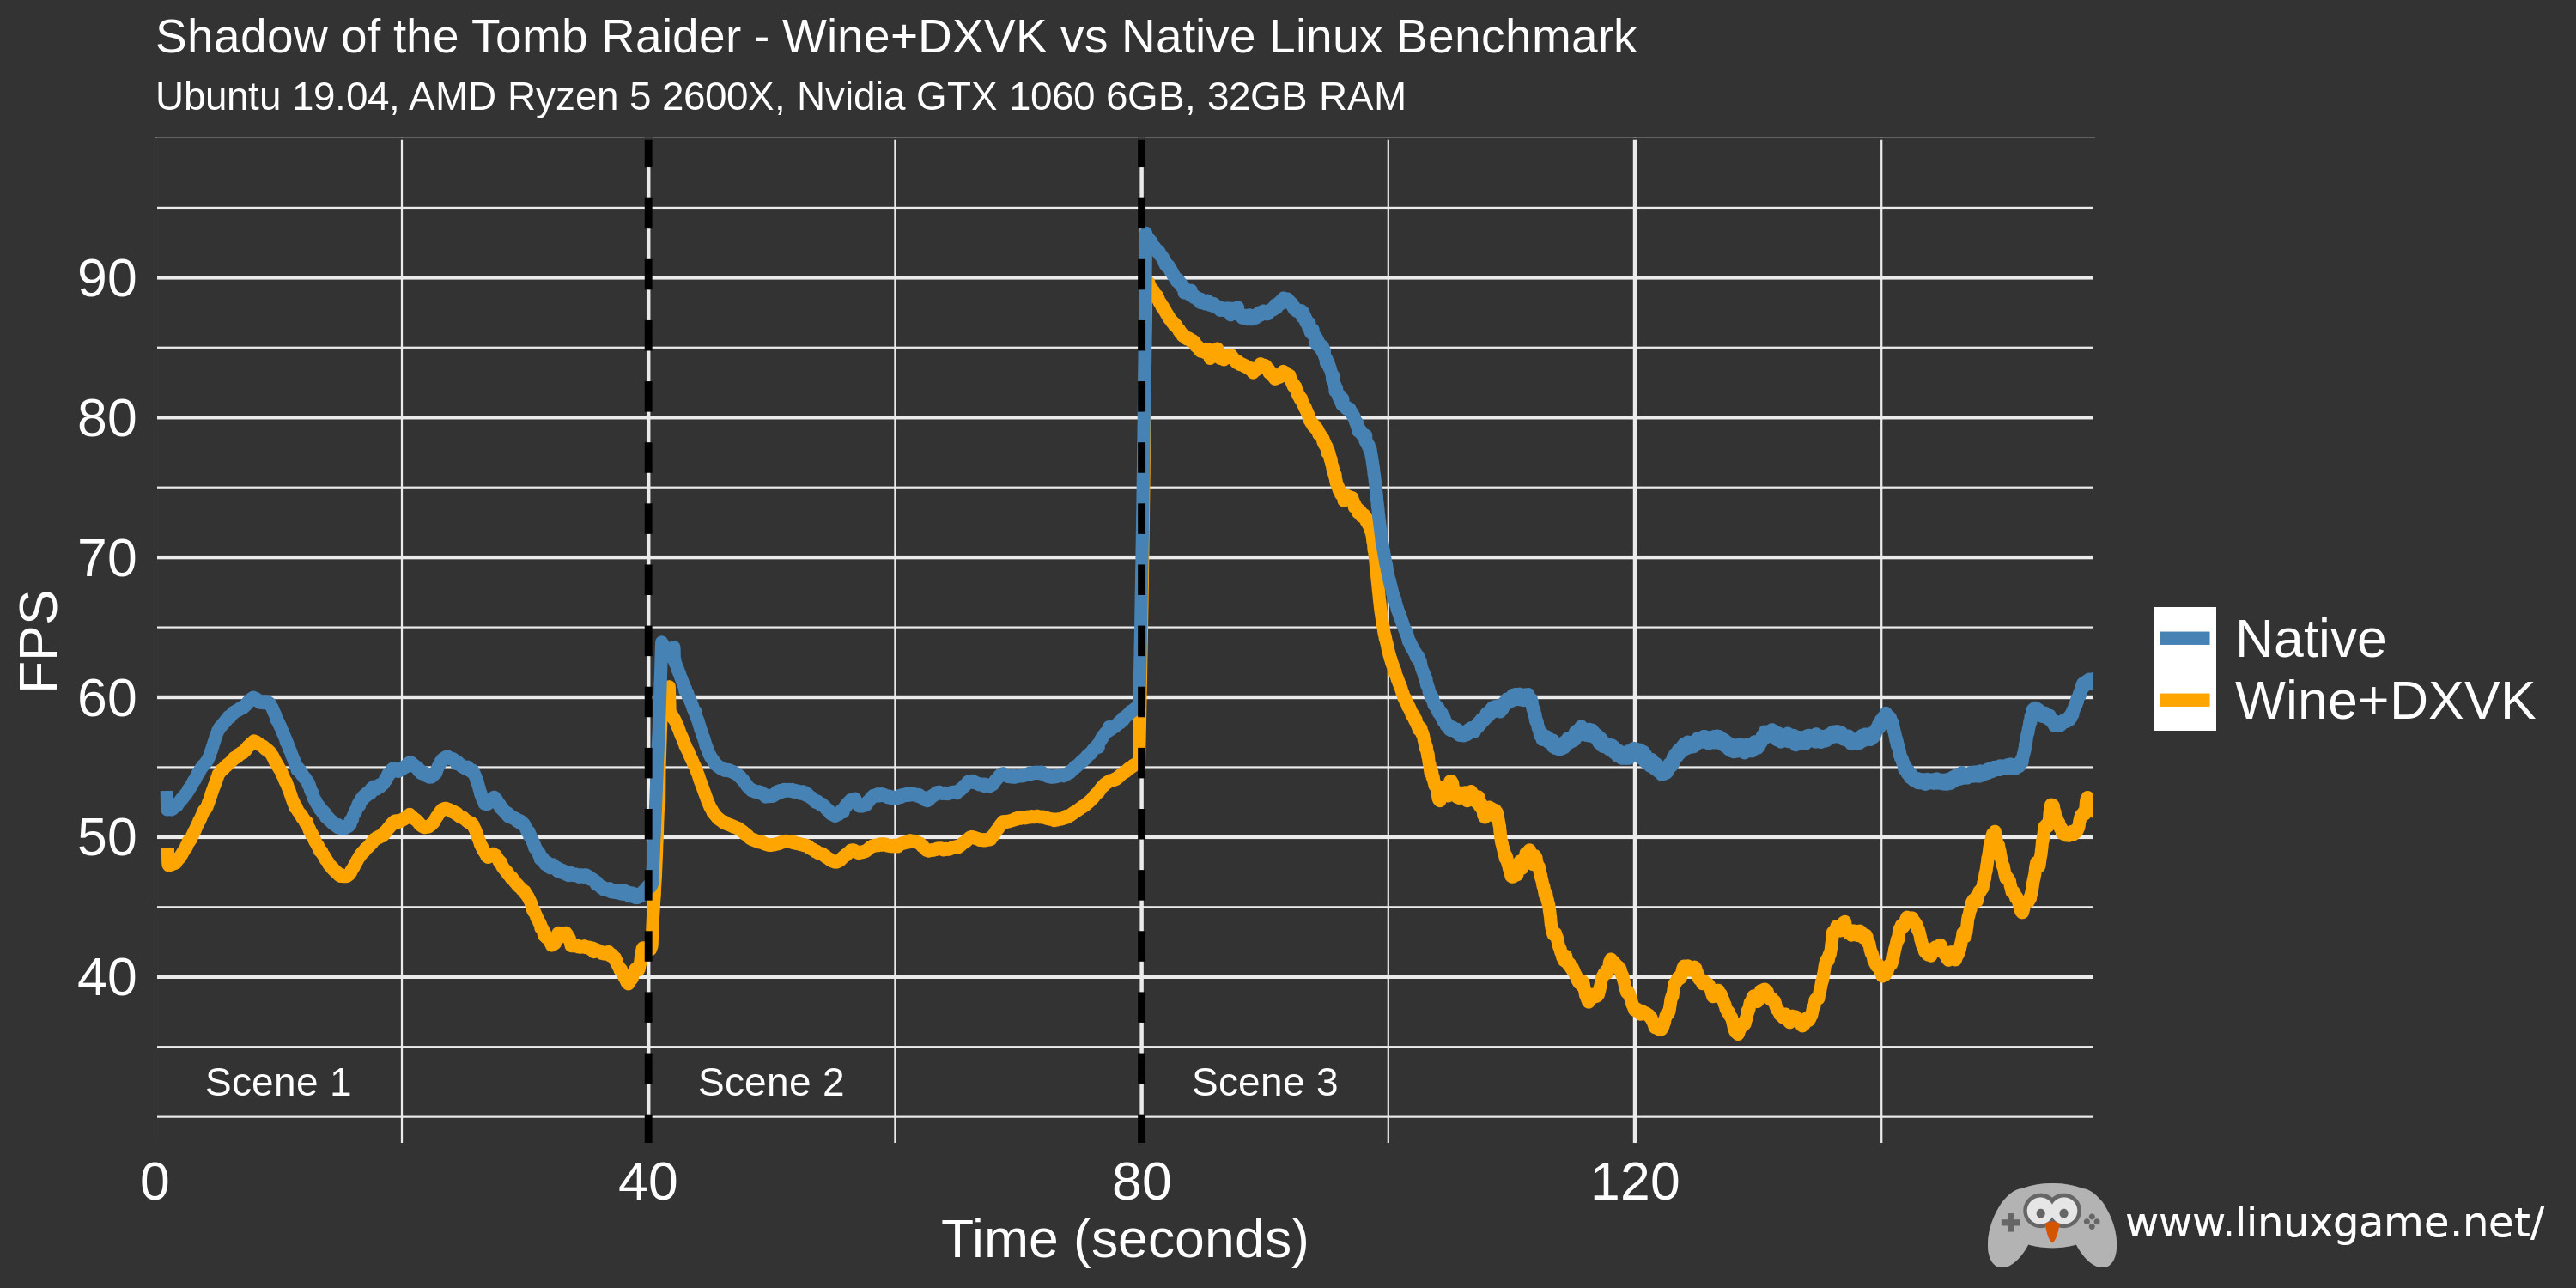
With FPS calculated, it's easy to use R and ggplot2 to make a nice graph showing the performance of the benchmark over time.
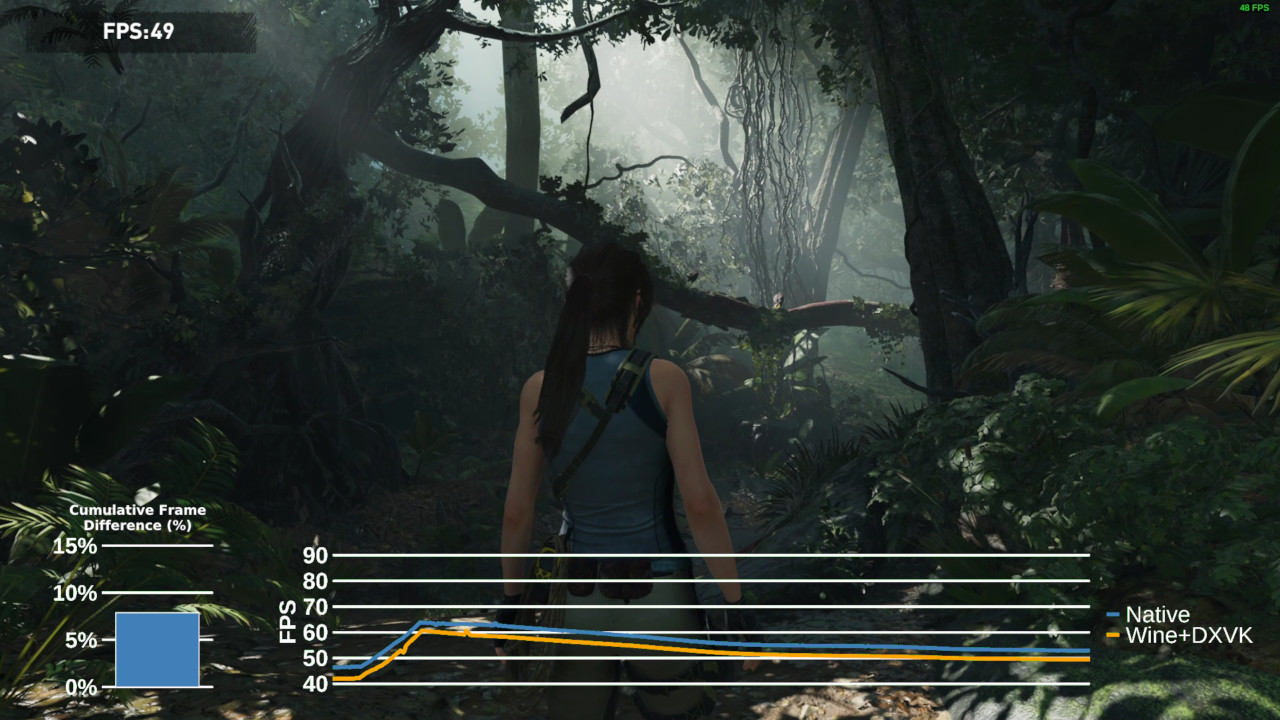
That's neat, but what I really wanted was to overlay the chart over footage of the actual benchmark so that people could see how different in-game scenes effect the frames-per-second. To do this I used a few tools: R again for the chart generation, ffmpeg to turn pictures into a video, and then Kdenlive to edit the video.
Generating Charts:
To embed a moving chart in a video, I used R and ggplot2 to generate 1 chart per video frame. That works out to 4000 individual charts due to the benchmark being 160 seconds long and wanting 25 frames per second. Each new frame shifts a window showing the next 1/25th of a second of data and 10 seconds worth data over the whole image.
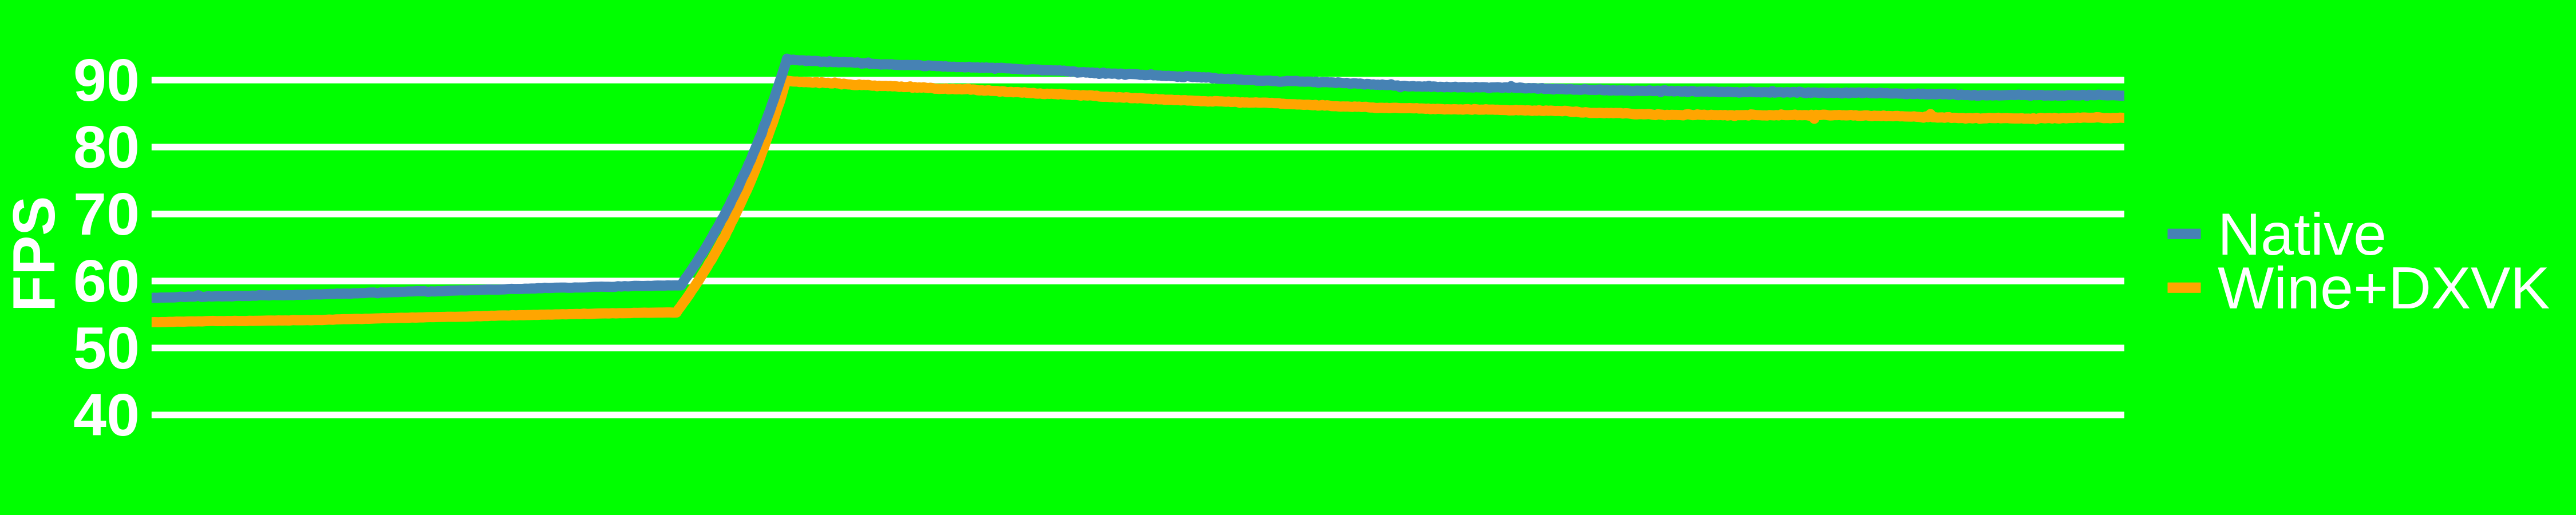
To make things look a bit nicer in the final video, the background of the charts had to be a colour that could easily be chroma keyed out. Chroma keying can remove a certain colour from a video layer, basically green screening. So all 4000 charts looked something like the following beautiful image.
Turning Charts into a Video:
Thankfully, turning a series of images into a video is rather common problem and there are a lot examples online of using ffmpeg to do this conversion. So I shameless borrowed the following command to turn all 4000 charts into a video. I won't pretend to know what all of the arguments do, but importantly it is set to 25 frames-per-second to match the timing of the generated charts. Without this the scrolling chart would be too fast or too slow and would not line up with the benchmark footage.
ffmpeg -r 25 -f image2 -start_number 1 -i plots/fps_%d.png -vcodec libx264 -profile:v high444 -crf 0 -pix_fmt yuv420p sottr_fps.mp4
Overlay FPS Video on top of Benchmark:
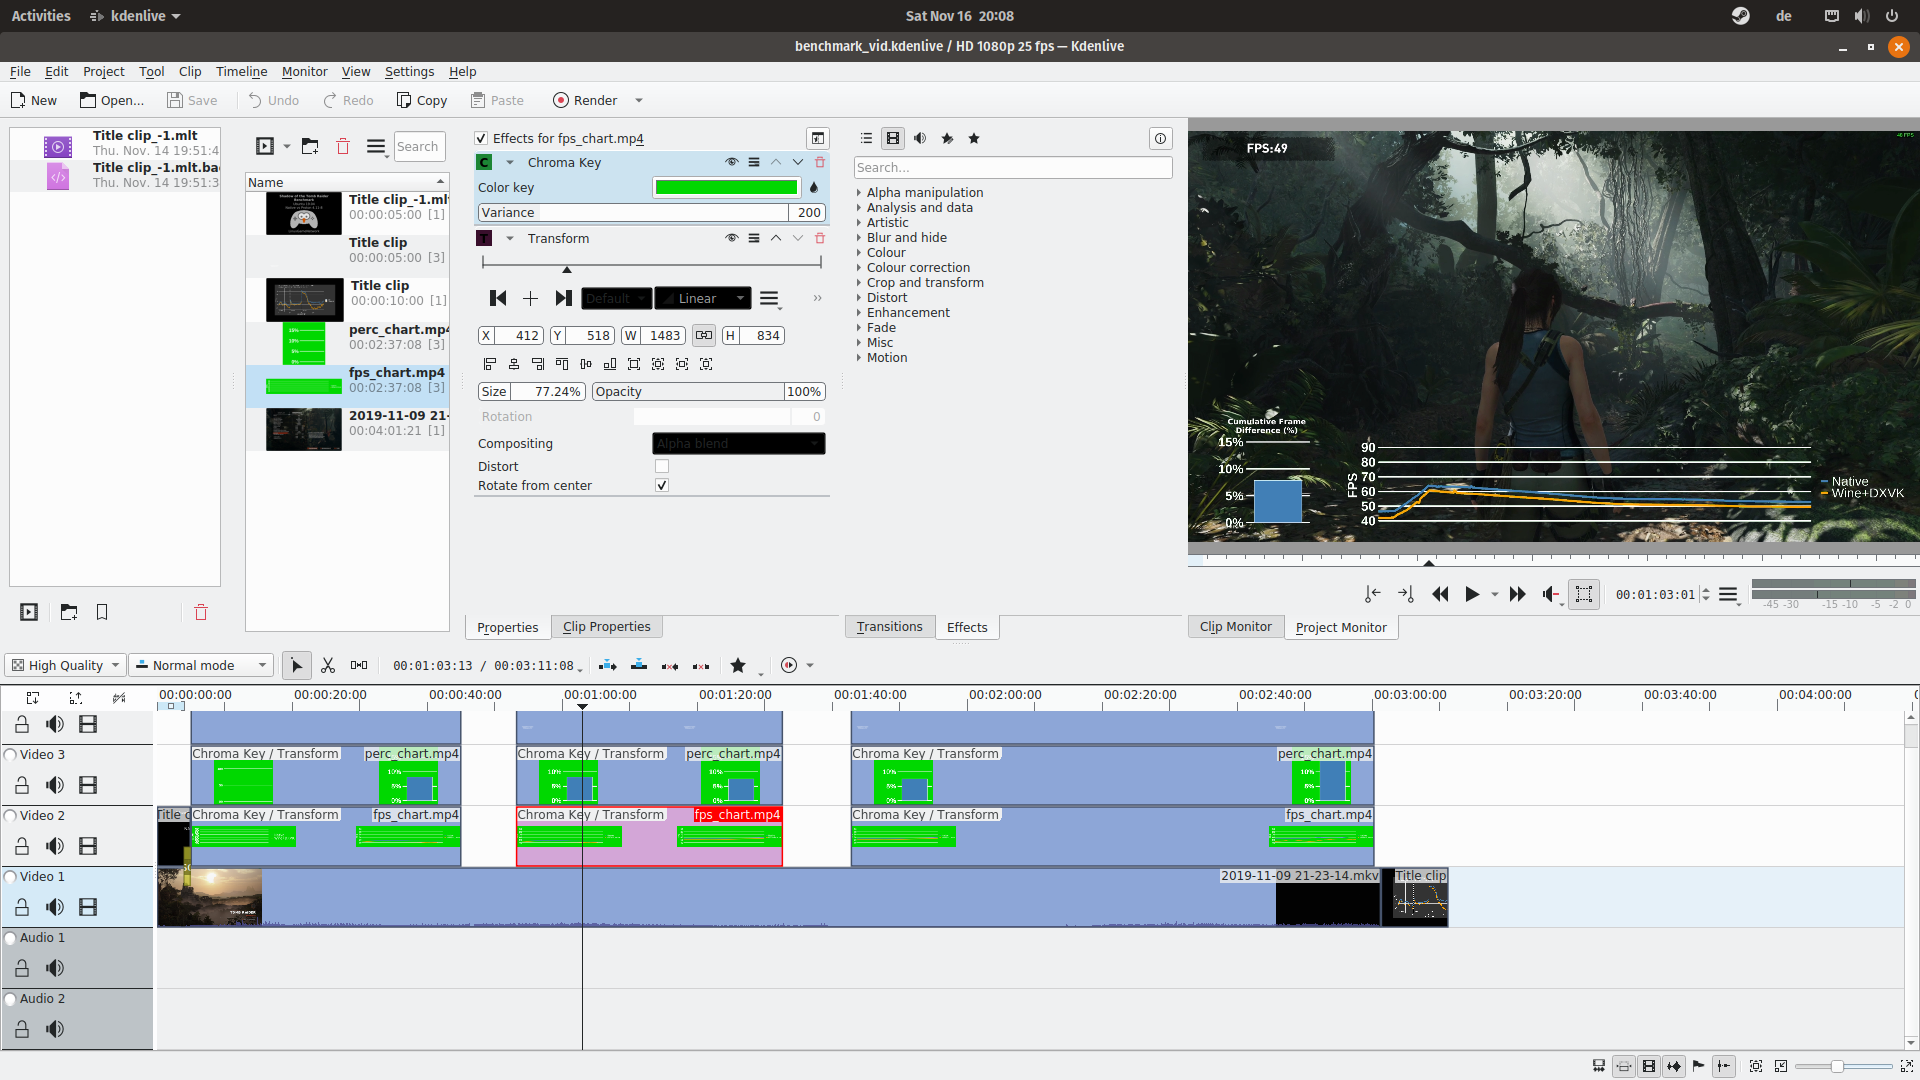
Kdenlive is an open-source video editor for Linux. Video editing is still one of the areas of desktop Linux that is still a bit lacking, but Kdenlive crucially has a chroma key feature which is the key component in this step. The video generated from the bright green charts is overlayed on the footage of the Tomb Raider benchmark then the chroma key is applied.
In this screenshot you can see the chroma key effect being applied to the bright green of the chart video. It removes the background and turns it into a very nice looking overlay.
So that's it. I really enjoyed this little project because it was the combination of several tools (R, ffmpeg, and Kdenlive) that really made it possible. Each had a specific task and it all came together nicely.
Check out the final result on YouTube.