My wife and I moved to Germany from Canada some time ago and every once-in-a-while we get a little homesick. So I wanted to do a project that can help a little bit in this area.
I wrote a webpage where my family can upload pictures and a short message, if they want. The pictures are sent directly to my home server via an http post request. The request is parsed and the metadata is stored in an SQLite database, while the pictures themselves are stored in a directory. In the interest of security, I made sure that this directory is not accessible outside of my personal network. My sister does not want pictures of her children on the internet (a good decision in my opinion) so this seemed like a good option to accommodate that.
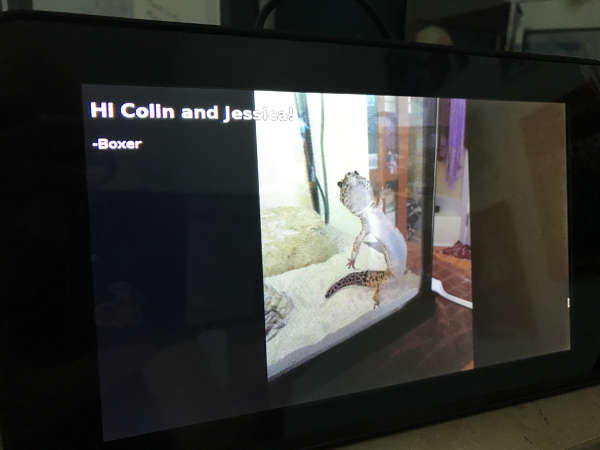
To display the pictures, a CGI script queries the SQLite database for a random image and uses it as the background in webpage. This is convenient because this allows me easily super-impose text using a bit of CSS. After all images have been displayed once, it resets and starts the cycle over again. Chromium is set up on the Raspberry Pi to auto-refresh the page every minute with a new picture.
For the display, I used the official Raspberry Pi touchscreen. The quality of the picture is, honestly, pretty bad and I would recommend shopping around for a nicer quality display if this project interests you.
All-in-all I’m quite happy with how it turned out and my wife definitely enjoys seeing new pictures of our family back home.
The code has also been uploaded to my Github.